The 2023 Real Local Budgets
Key Points:
- Over the last decade, major Montana local governments have grown their budgets faster than population growth plus inflation, burdening taxpayers with millions in excessive spending.
- The 2023 Real Local Budgets demonstrate the need for government spending restraint and an improved budget process to protect taxpayers.
- City and county officials should focus on holding the growth of expenditures to less than population growth plus inflation to ensure that the cost of government stays within the bounds of the average taxpayers’ ability to pay for it.
The Need for Fiscal Spending Limits
The growth of the economy, as measured by Montana’s population growth plus inflation, provides a measuring stick for fiscal responsibility by accounting for potential changes in economic conditions indicating the demand for government services and the cost of providing them. This benchmark also helps account for more people and higher wages, which, combined, provide resources for the average taxpayers’ ability to pay to fund government expenditures.1
Montana leaders have pointed to the growth of population growth plus inflation as the fairest measure for government growth.2
Excessive Spending Burdens Taxpayers
Montana’s Constitution requires that all local governments balance their budgets. County and city budgets are paid for primarily by taxpayers through a combination of fees, assessments, and property taxation. Excessive spending that grows beyond the rate of economic growth, as measured by population growth plus inflation, requires governments to raise additional revenues resulting in a higher tax burden.
The 2023 Real Local Budgets
Frontier Institute partnered with leading economists at the Texas Public Policy Foundation to put together an analysis of budgets for Montana’s six most populous counties and cities compared to the metric of population growth plus inflation over the last decade.
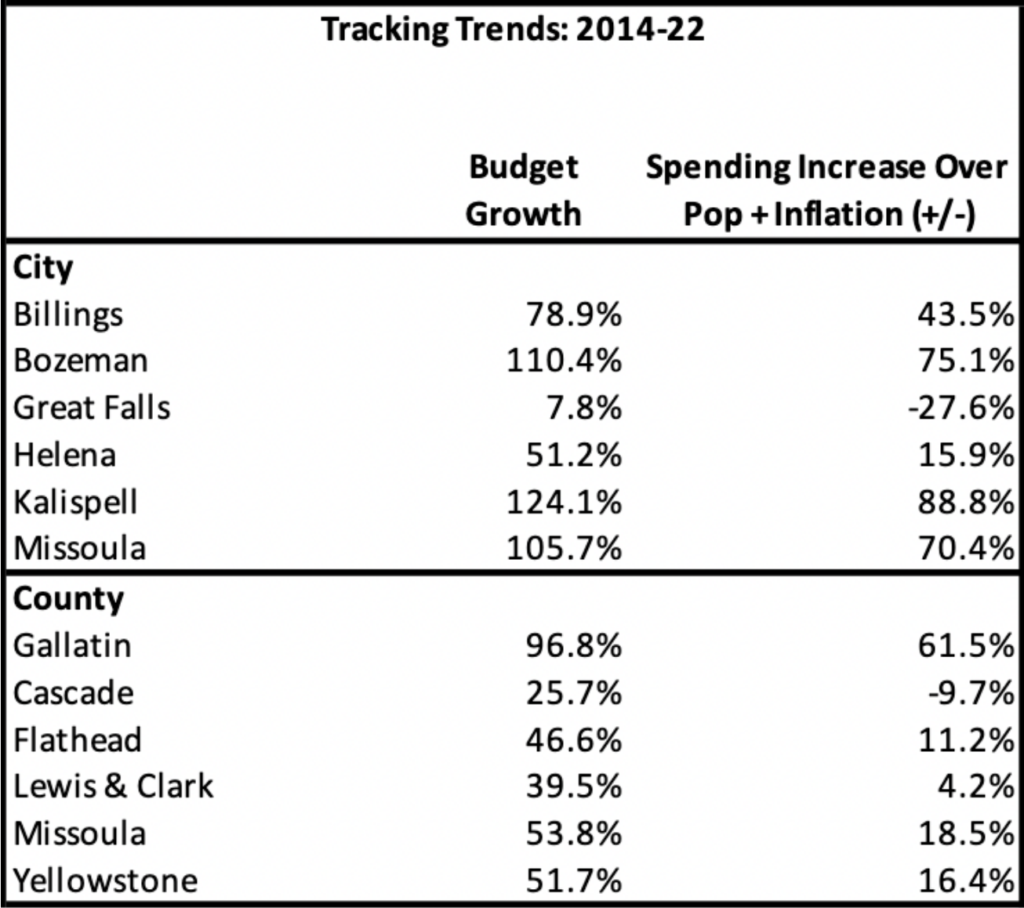
The table below shows the overall growth of spending in each county and city budget compared with population growth plus inflation from 2014-2022.
The average county budget increase is 17-percentage points over population growth plus inflation, while the average city budget increase is 44-percentage points over.
Helena & Lewis & Clark County
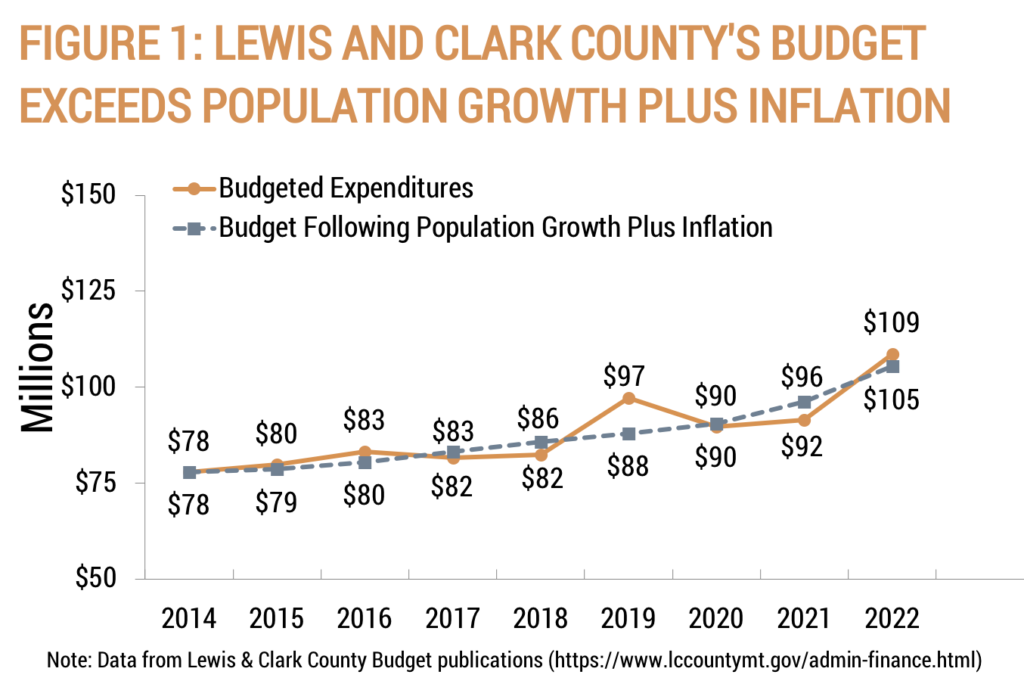
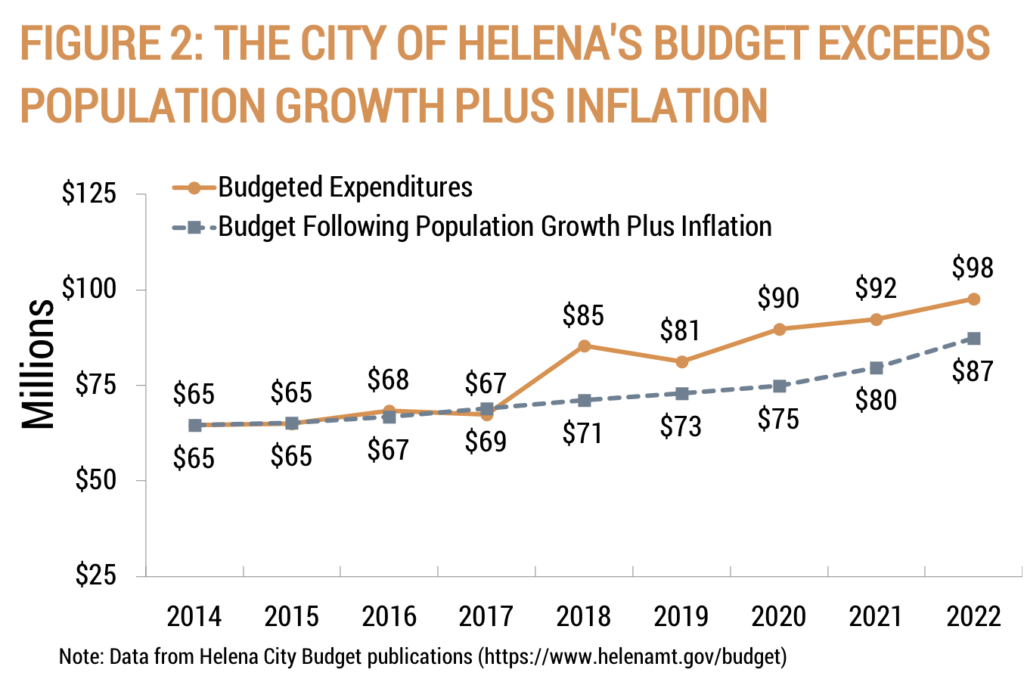
Figures 1 and 2 show how taxpayers are footing the bill for a combined $14 million more in spending during FY 2022 than if Helena and Lewis & Clark County had increased their budgets each period since FY 2014 by this key metric.
Since FY 2014, Lewis & Clark County’s budget has grown 3.10% faster than the growth of the economy, as measured by population growth plus inflation:
Since FY 2014, the City of Helena’s budget has grown 11.75% faster than the growth of the economy, as measured by population growth plus inflation:
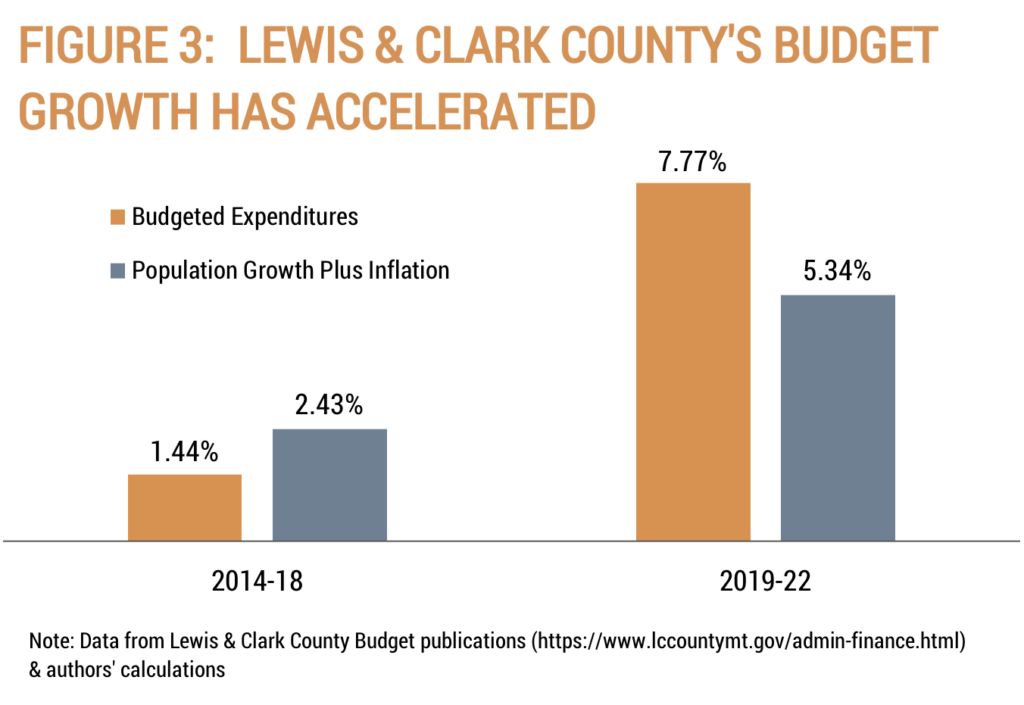
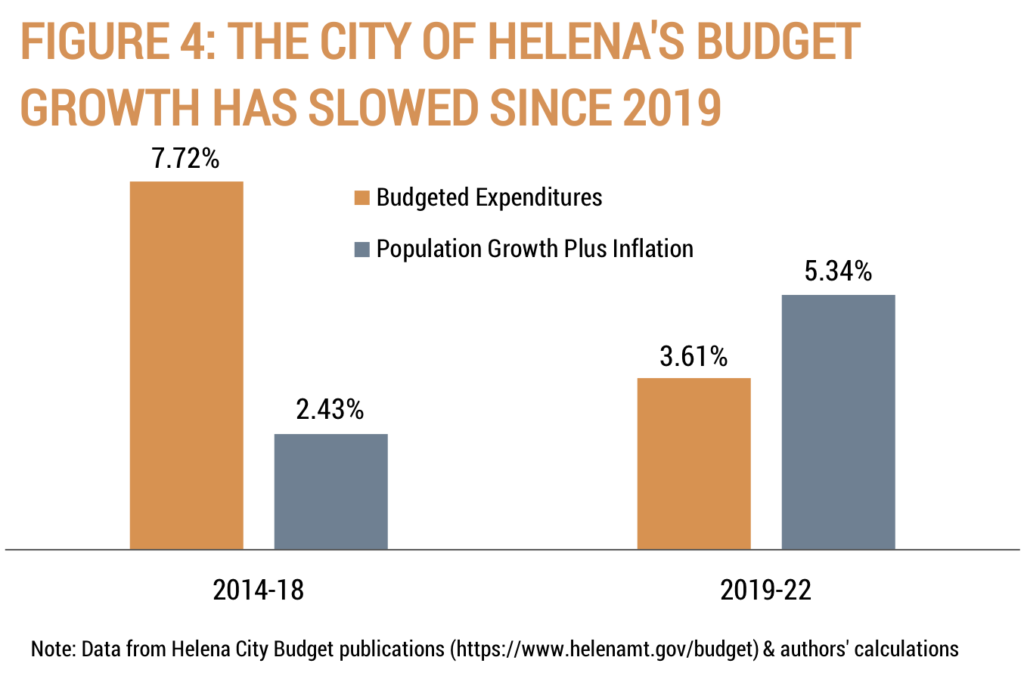
Figures 3 and 4 show the average annual budget growth for Helena and Lewis & Clark County.
Lewis & Clark County’s average annual budget growth has accelerated since 2019:
The City of Helena’s average annual budget growth has slowed since 2019:
Billings & Yellowstone County
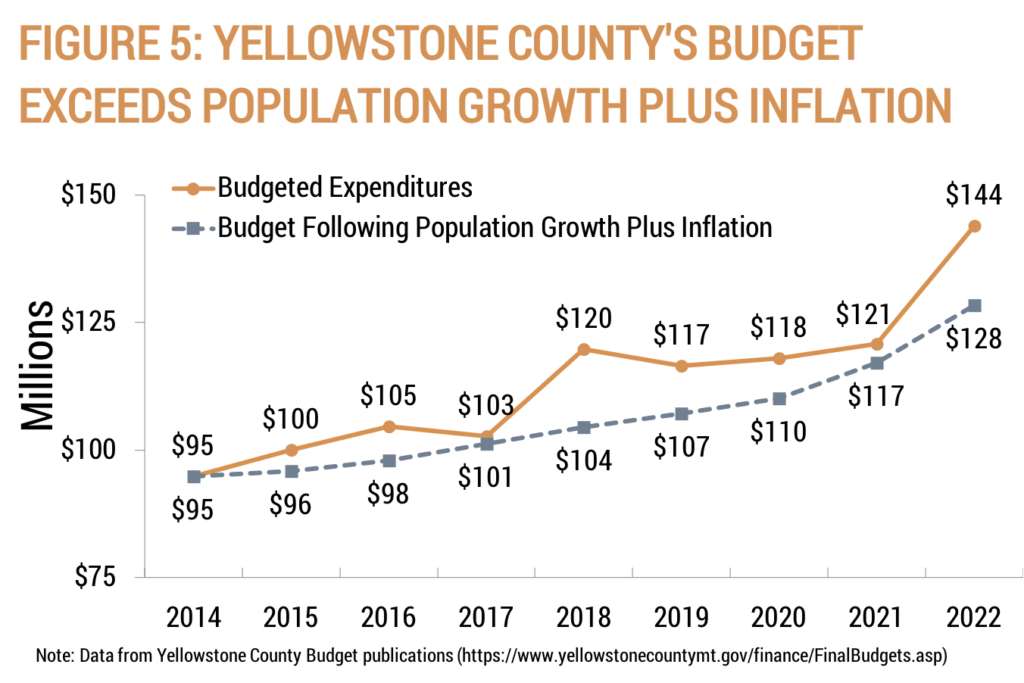
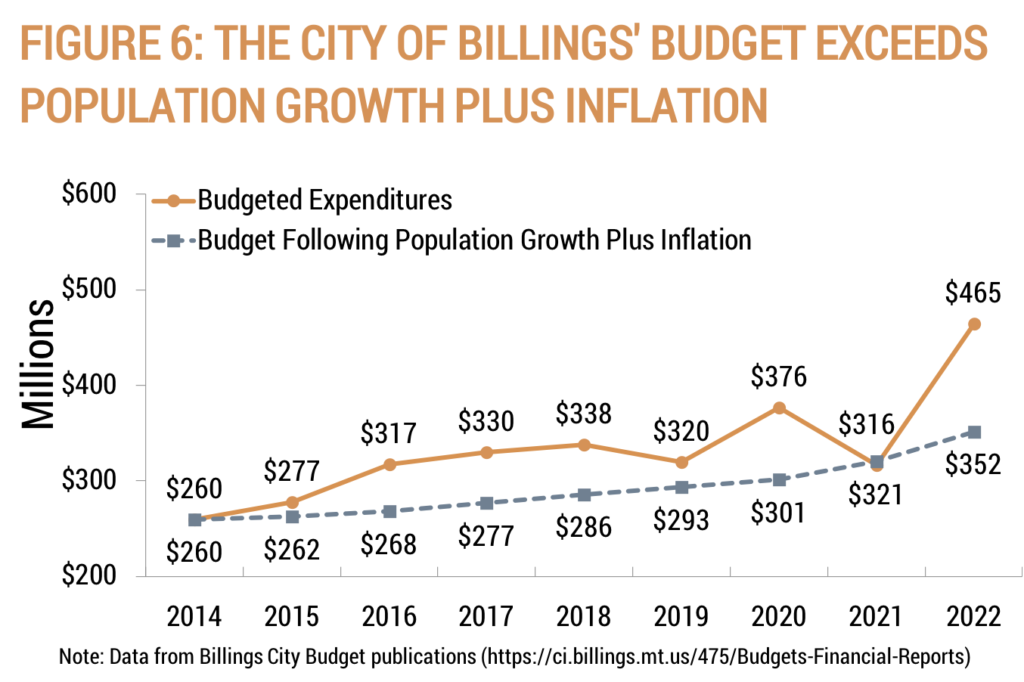
Figures 5 and 6 show how taxpayers are footing the bill for a combined $129 million more in spending during FY 2022 than if Billings and Yellowstone County had increased their budgets each period since FY 2014 by this key metric.
Since FY 2014, Yellowstone County’s budget has grown 12.1% faster than the growth of the economy, as measured by population growth plus inflation:
Since FY 2014, the Billings’ budget has grown 32.16% faster than the growth of the economy, as measured by population growth plus inflation:
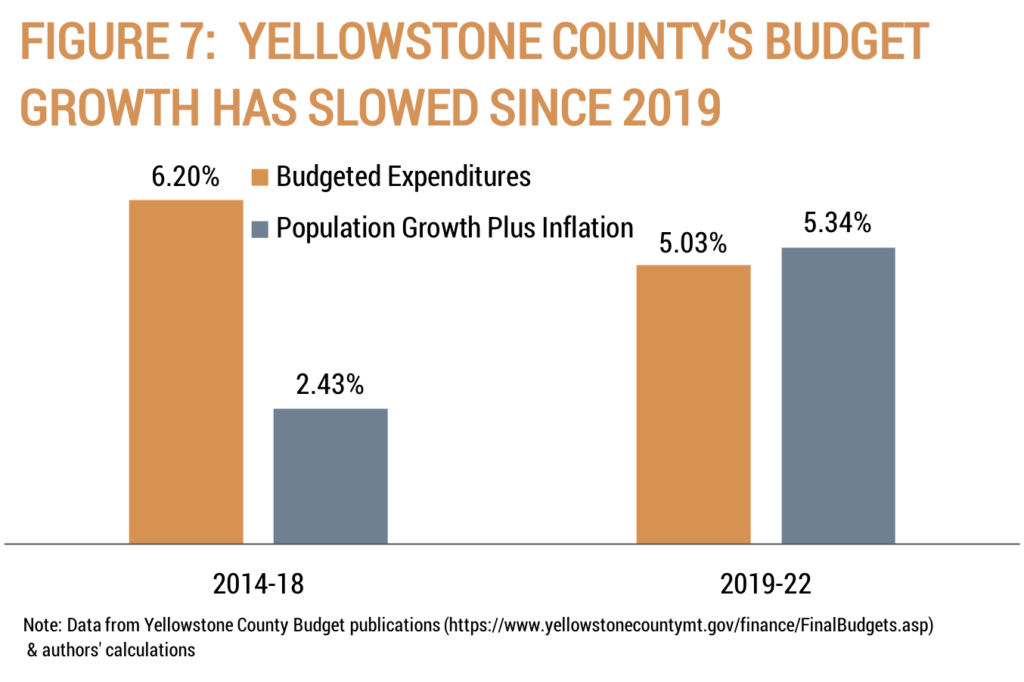
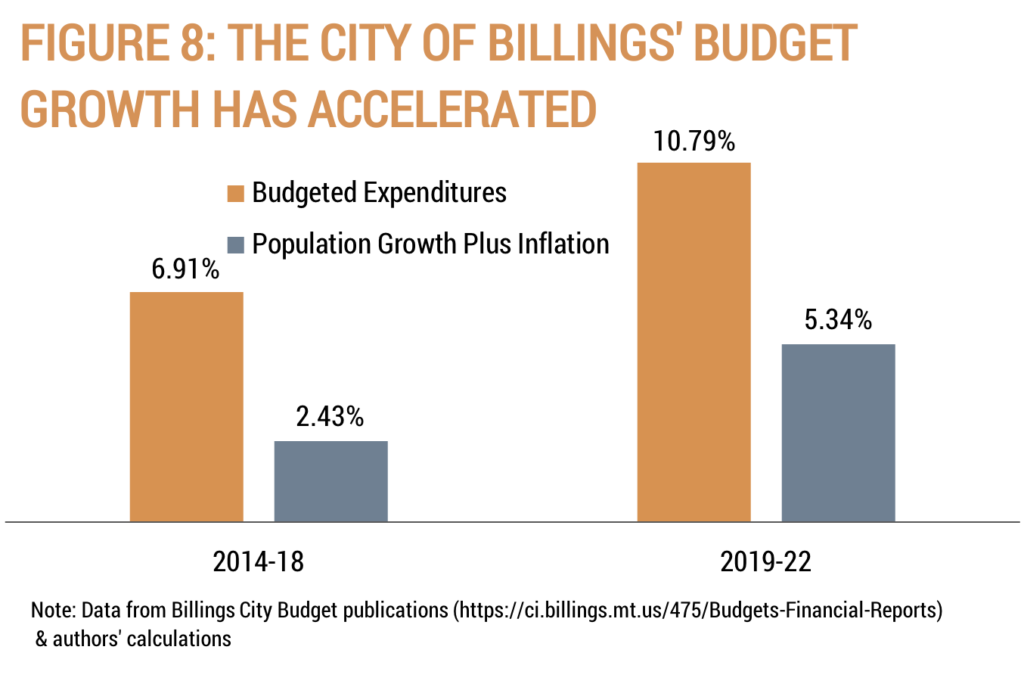
Figures 7 and 8 show the average annual budget growth for Billings and Yellowstone County.
Yellowstone County’s average annual budget growth has slowed since 2019:
The City of Billings’ average annual budget growth has accelerated since 2019:
Great Falls & Cascade County
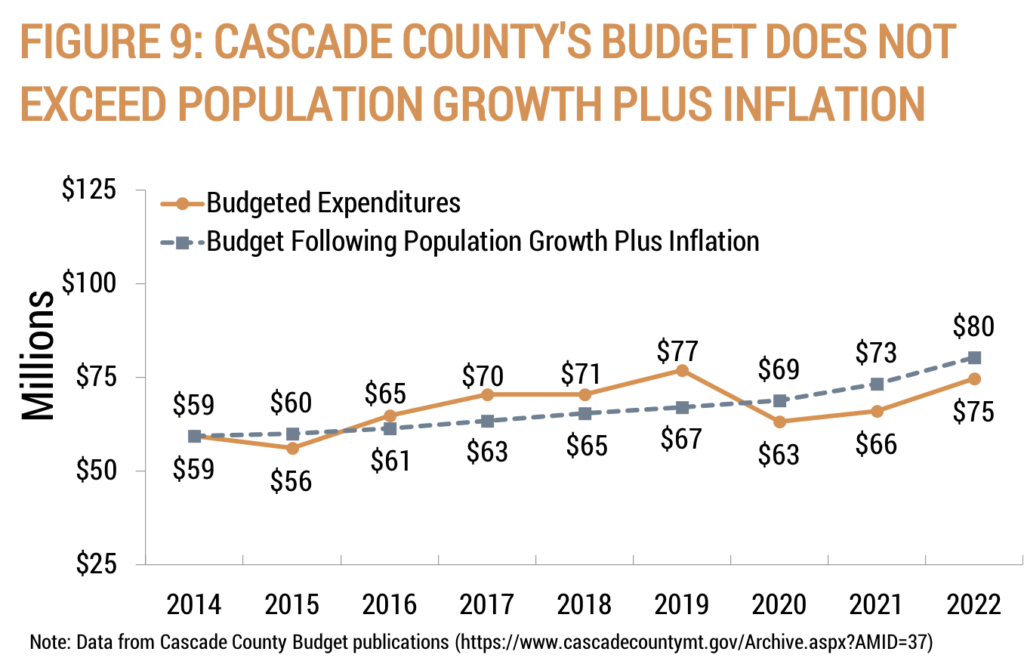
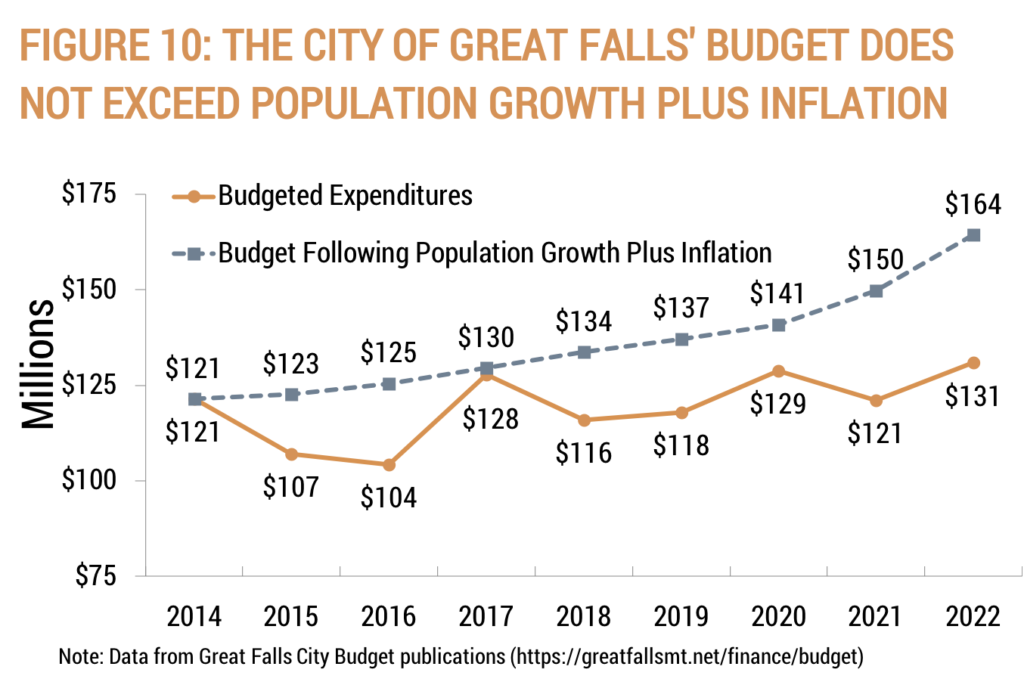
Figures 9 and 10 show how taxpayers were protected with a combined $39 million in less spending during FY 2022 because Great Falls and Cascade County have kept spending below population growth plus inflation.
Since FY 2014, Cascade County’s budget has grown 7.3% slower than the growth of the economy, as measured by population growth plus inflation:
Since FY 2014, the City of Great Falls’ budget has grown 20.36% slower than the growth of the economy, as measured by population growth plus inflation:
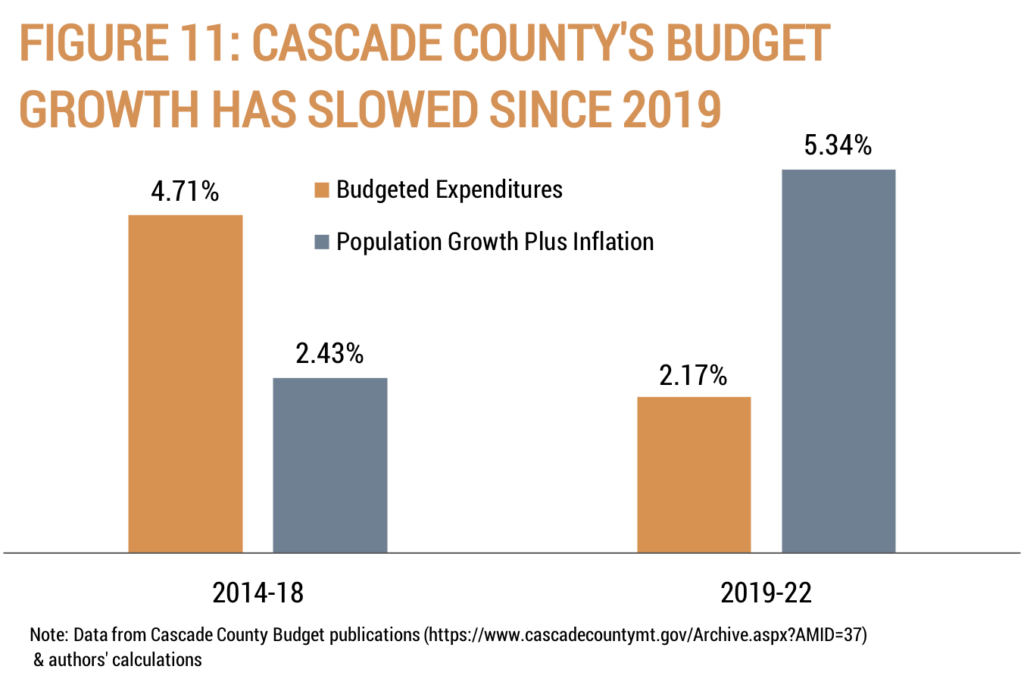
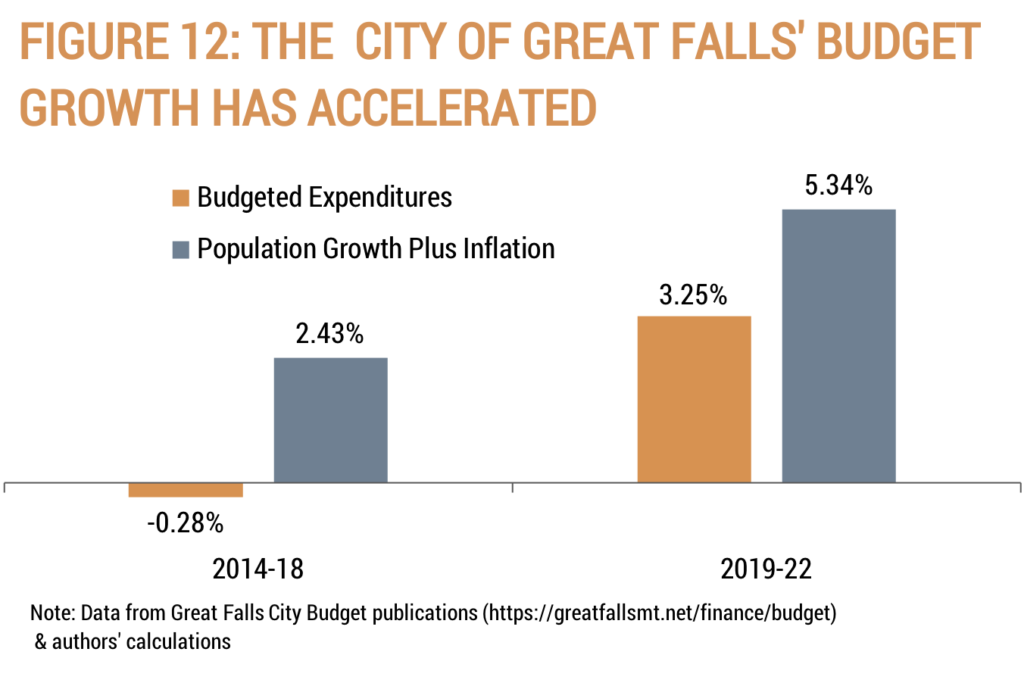
Figures 11 and 12 show the average annual budget growth for Great Falls and Cascade County.
Cascade County’s average annual budget growth has slowed since 2019:
The City of Great Falls’ average annual budget growth has accelerated since 2019, but remains below population growth plus inflation:
Kalispell & Flathead County
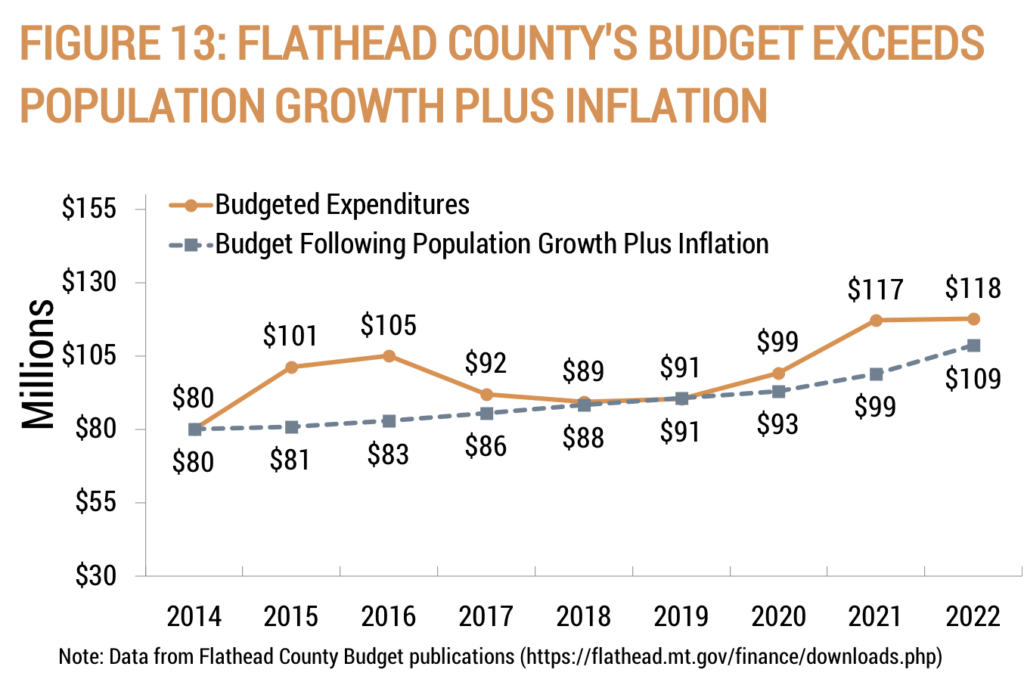
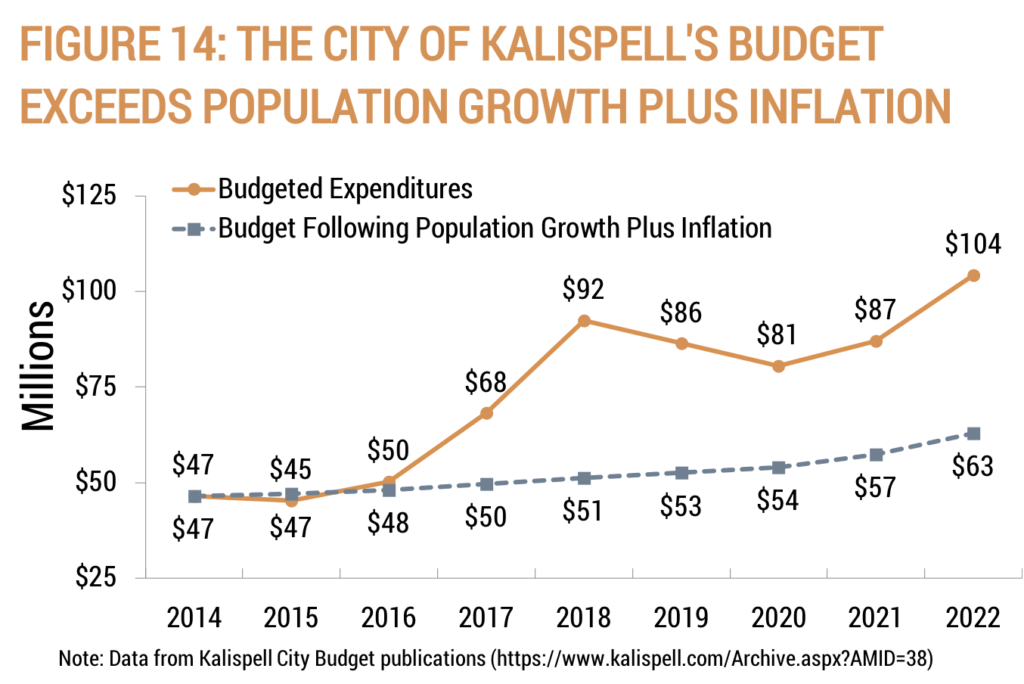
Figures 13 and 14 show how taxpayers are footing the bill for a combined $50 million more in spending during FY 2022 than if Kalispell and Flathead County had increased their budgets each period since FY 2014 by this key metric.
Since FY 2014, Flathead County’s budget has grown 8.3% faster than the growth of the economy as measured by population growth plus inflation:
Since FY 2014, the City of Kalispell’s budget has grown 65.6% faster than the growth of the economy, as measured by population growth plus inflation:
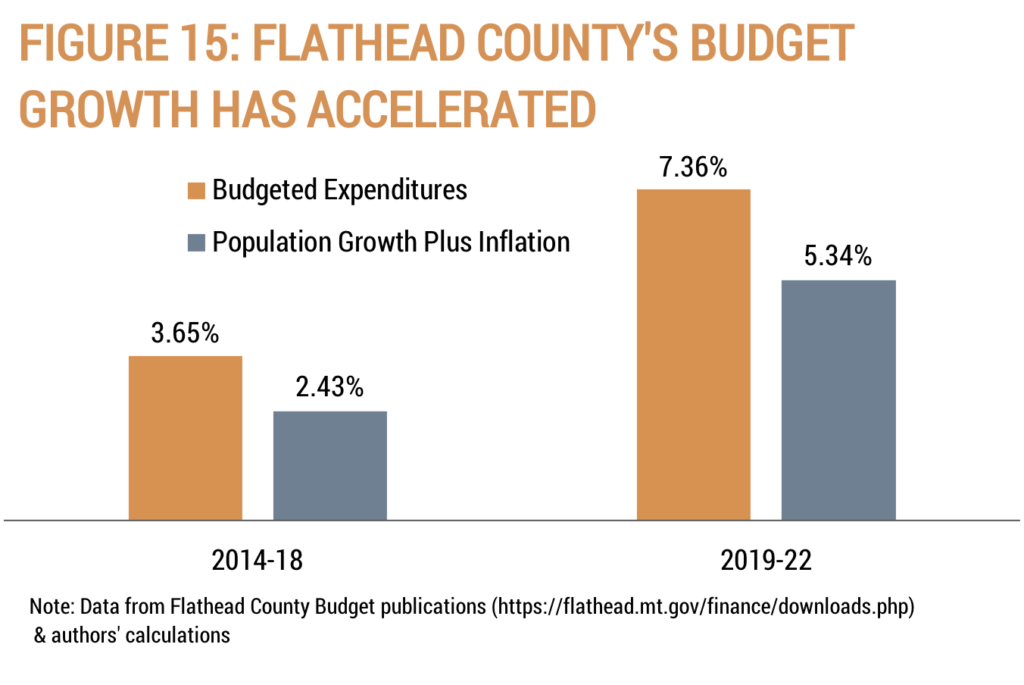
Figures 15 and 16 show the average annual budget growth for Kalispell and Flathead County.
Flathead County’s average annual budget growth has accelerated since 2019:
Bozeman & Gallatin County
Figures 17 and 18 show how taxpayers are footing the bill for a combined $126 million more in spending during FY 2022 than if Bozeman and Gallatin County had increased their budgets each period since FY 2014 by this key metric.
Since FY 2014, Gallatin County’s budget has grown 43.13% faster than the growth of the economy as measured by population growth plus inflation:
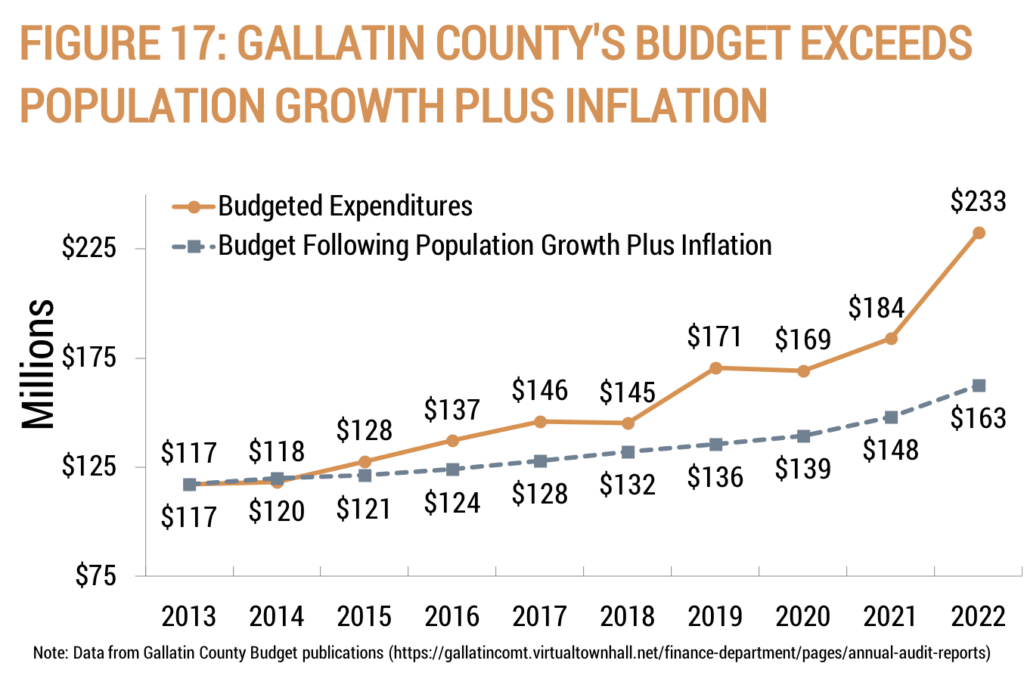
Since FY 2014, the City of Bozeman’s budget has grown 55.5% faster than the growth of the economy, as measured by population growth plus inflation:

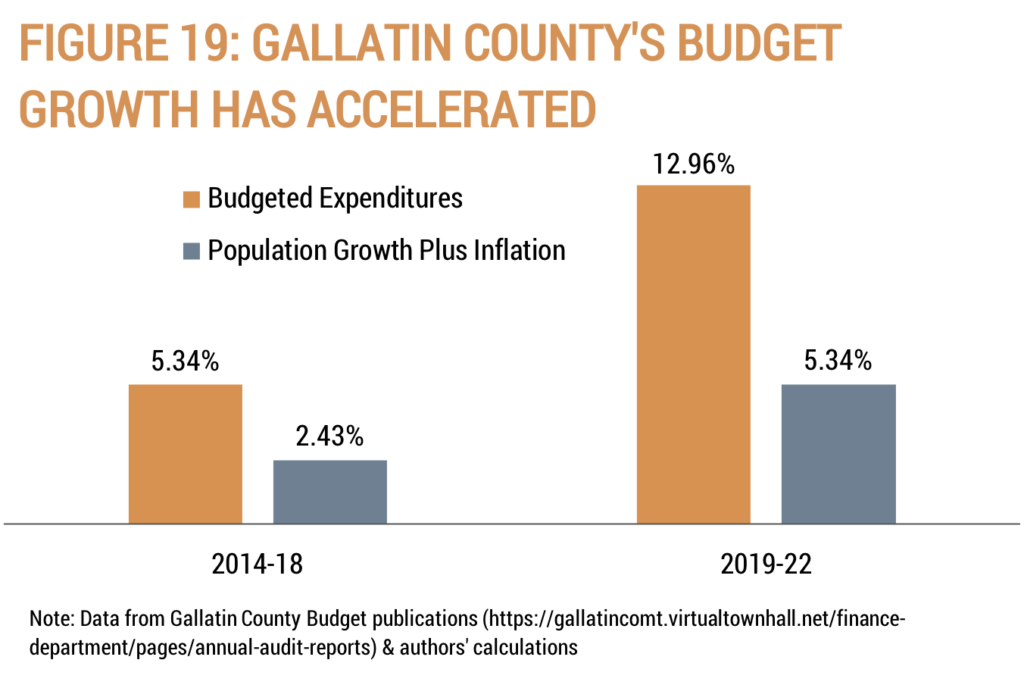
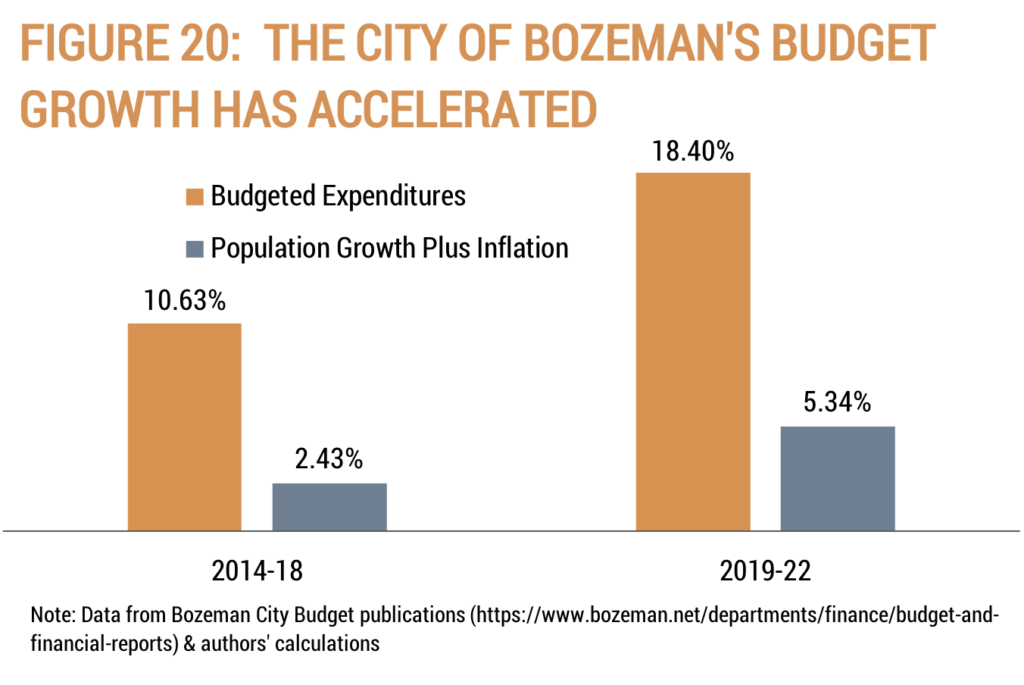
Figures 19 and 20 show the average annual budget growth for Bozeman and Gallatin County.
Gallatin County’s average annual budget growth has accelerated since 2019:
The City of Bozeman’s average annual budget growth has accelerated since 2019:
Missoula & Missoula County
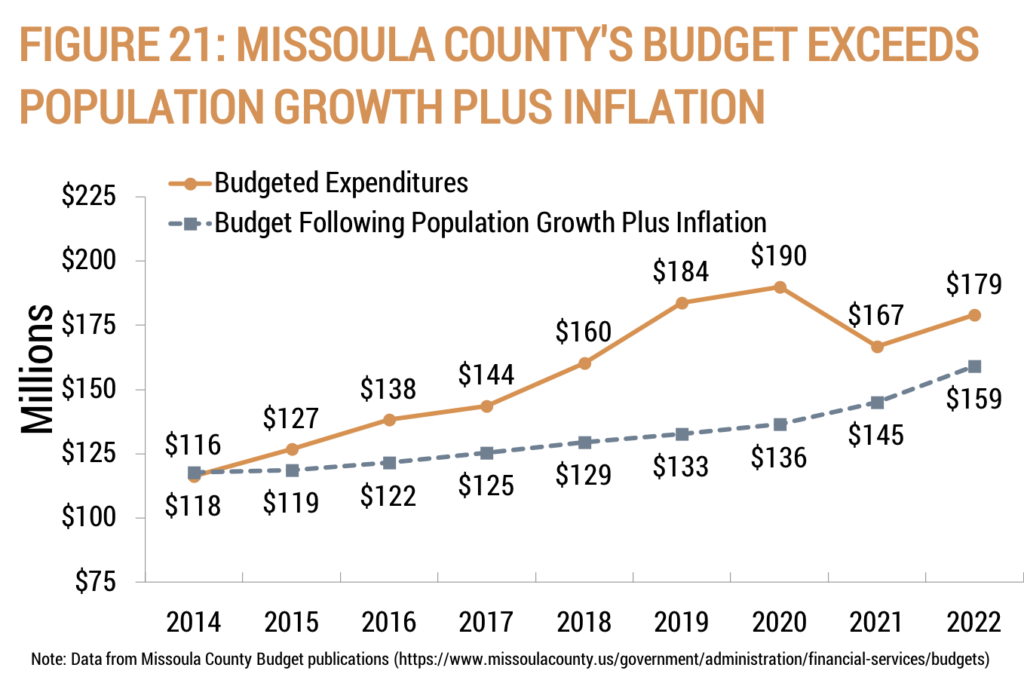
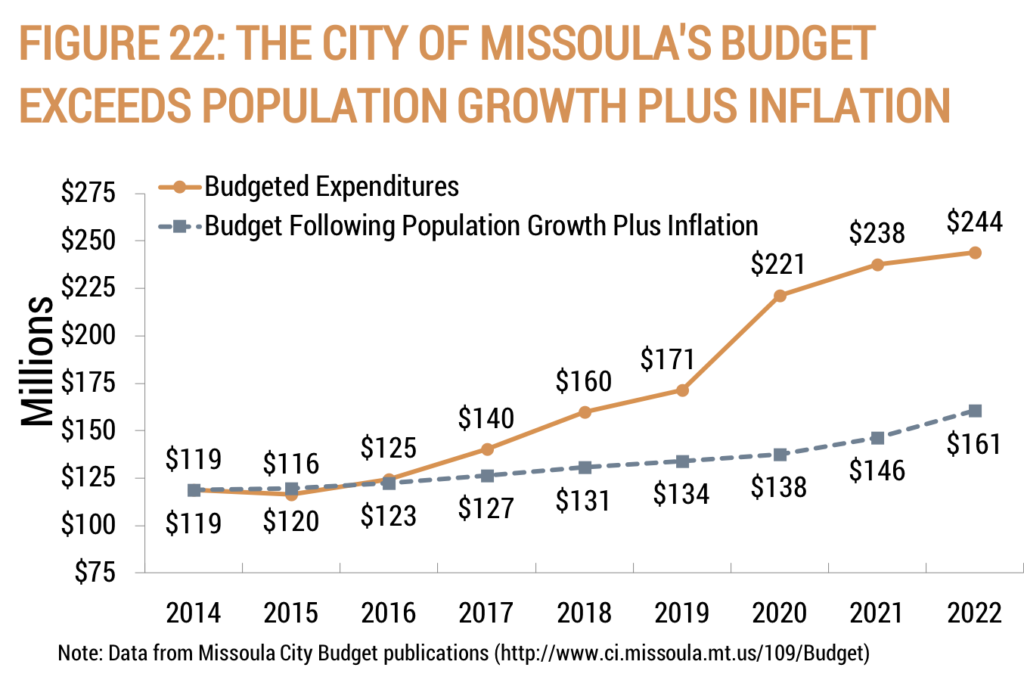
Figures 21 and 22 show how taxpayers are footing the bill for a combined $103 million more in spending during FY 2022 than if Missoula and Missoula County had increased their budgets each period since FY 2014 by this key metric.
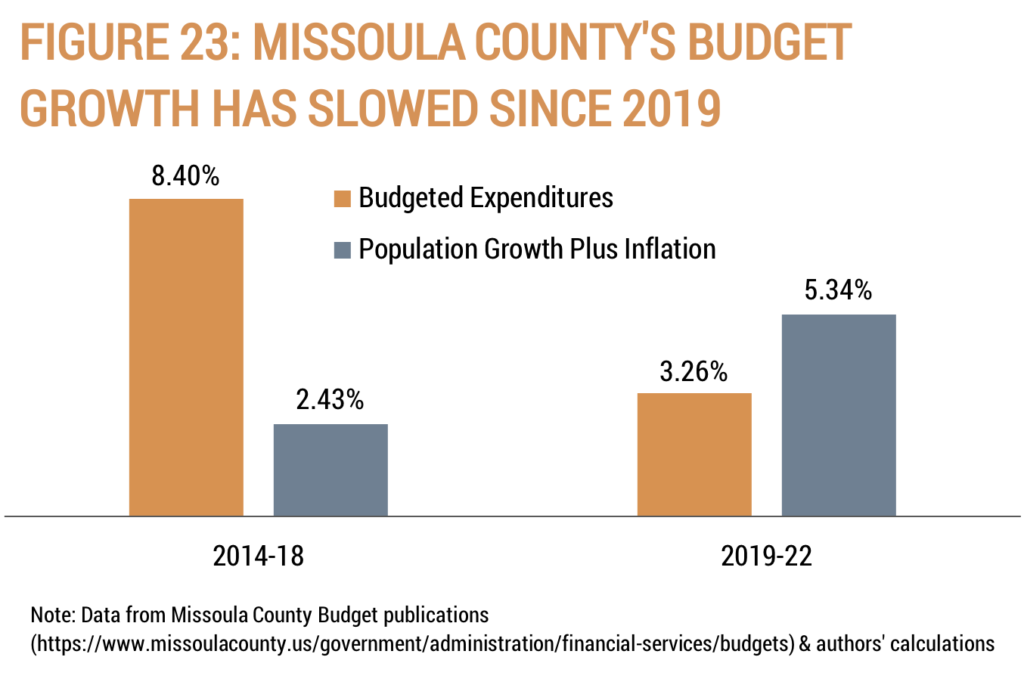
Since FY 2014, Missoula County’s budget has grown 12.39% faster than the growth of the economy as measured by population growth plus inflation:
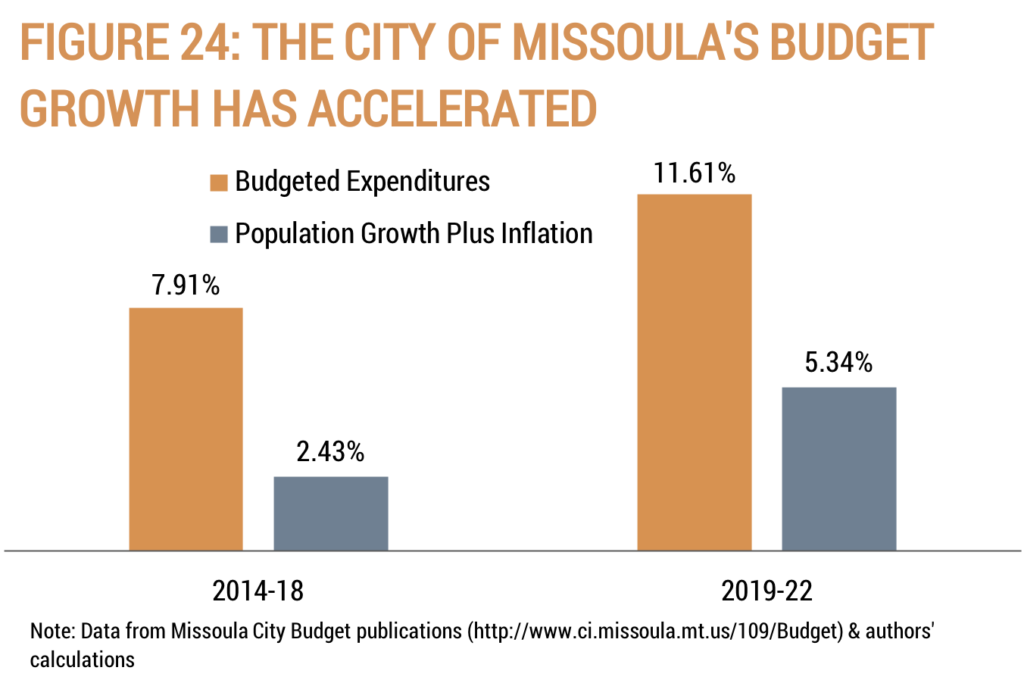
Since FY 2014, the City of Missoula’s budget has grown 51.98% faster than the growth of the economy, as measured by population growth plus inflation:
Figures 23 and 24 show the average annual budget growth for Missoula and Missoula County.
Missoula County’s average annual budget growth has slowed since 2019:
The City of Missoula’s average annual budget growth has accelerated since 2019:
Conclusion
Many major local government budgets have grown faster than taxpayers’ ability to pay for it over the last 10 years. Limiting local governments’ budget growth, and even reducing it as many families have done with their budgets when faced with rising costs, will provide more opportunities to provide tax relief. Local government officials should focus on holding the growth of budgeted expenditures to less than population growth plus inflation to ensure that the cost of government stays within the bounds of the average taxpayers’ ability to pay for it.