Key Points:
- Increased public education funding has not translated into better academic outcomes for Montana students.
- Since 2018, total enrollment in Montana public schools only increased by 2% but funding grew by 27%.
- Instruction and student services have gotten a smaller and smaller slice of the funding pie as schools spend more money on facilities and administration.
- The average Montana teacher salary is around $53,000, less than 15% of the funding available for a classroom of 25 students and only 30% of what the schools say they are spending on instruction.
- By investing taxpayer dollars in innovation, school choice, and healthy competition, Montana may be able to start getting more bang for the taxpayer buck.
Background
From 2022 to 2023, Montana homeowners experienced a 21% median increase in property taxes according to the Montana Free Press. An estimated $213 million dollars in extra tax revenues were collected. Of that amount, $70 million were allocated to the “95 mills,” the statewide school funding equalization tax.
Montana finances its state public school system through a combination of federal, state, and local sources. Local funding for public schools comes from the taxes paid by local property owners. In recent years, property taxes alone have accounted for over a quarter of the $2.3 billion Montana spends on public education. Historically, state and federal sources have contributed over half of school funding.
Now, going into the next local election cycle, many Montana voters will be asked to raise local taxes to increase funding for public schools. There are two questions voters should ask – do school districts need more funding? What would additional money accomplish?
To answer these questions, we want to explore 3 topics:
- Better Results. If increasing public funding has led to better school performance in past years, there may be good reason to increase funding now.
- Needier Students. If students are demonstrating greater need, there may be reason to allocate more funding to classroom teachers and student services.
- Declining Funding. If funding has decreased in recent years, there may be a reason to restore it to past levels.
Unless there is a clear reason, we do not know why voters would approve higher property taxes. Overall, there is real merit to keeping funding the same or reducing it if taxpayers do not see any benefit to increasing funding.
Is Public School Performance Getting Better?
Since 2018, increased funding has not translated into better academic outcomes for Montana students.
With overall public school funding at the highest level ever in Montana, the recent release of the 2022-2023 State Report Card is a troubling snapshot of ongoing academic declines. The Academic Achievement indicator on the State Report Card uses individual student scores on annual state tests as a measure of a student’s proficiency relative to grade level standards. Specifically, the Report Card draws upon the Smarter Balanced assessment in grades 3 through 8 and the ACT for 11th grade.
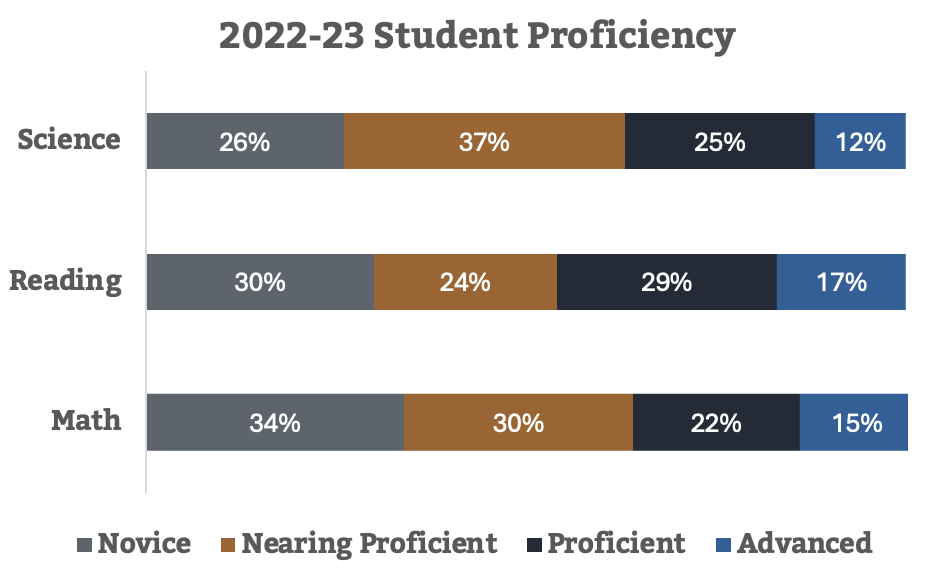
As the chart at the top of the next page indicates, the majority of Montana students are not grade-level proficient in Math, Reading, or Science. Specifically, 64% of students scored below proficient in Math, 54% of students scored below proficient in Reading, and 63% of students scored below proficient in Science. Across all 3 subjects, that means that only about one-third of all tested students in the state are achieving proficient or advanced levels of learning.
In our view, the most concerning part is that at least one out of four students in Montana are at a “Novice” level of proficiency, meaning “the student has not met the achievement standard and needs substantial improvement to demonstrate the knowledge and skills needed for success in entry-level credit bearing coursework after high school.”
Academic outcomes among high schoolers have been similarly poor. The ACT serves as Montana’s chosen statewide assessment but also provides a benchmark to determine the likelihood of success in college.
For the 2022-23 school year, 67% of 11th grade students did not meet the ACT benchmark in Mathematics and 54% of tested students fell below the ACT benchmark in English Language Arts. Those low scores were registered 11 years after the state of Montana formally adopted the ACT to benchmark academic proficiency.

In past editions of this monthly series, we have examined Montana’s performance on the National Assessment of Education Progress (NAEP), the Nation’s Report Card. Looking across testing years from 2011 to 2022, Montana shows a significant long-term decline. In 2022-23, the most recent year of NAEP testing, only 29% of students scored at or above proficient in Reading and Mathematics, which is down from 37% and 39% respectively.
As the data indicates, despite more money going to Montana’s public schools, academic outcomes have shown little or no sign of improving.
Has The Student Population Become Needier?
Like all states, Montana schools had to cope with the COVID-19 pandemic effects on education in 2020 and 2021. However, the state has been very well funded to do so through several rounds of Elementary and Secondary School Emergency Relief (ESSER) dollars administered by the U.S. Department of Education. In total, Montana schools received approx. $585 million to address student needs during the Pandemic and recovery over multiple academic years. With the Pandemic now in the rearview mirror, it is important to avoid building special Pandemic relief costs into the state’s long-term cost structure for providing elementary and secondary education.
A key reason that public schools would need more ongoing funding is if the student population is demonstrating greater long-term or permanent needs. For example, there could be an increase in students with diagnosed disabilities, English language learners (ELL), or students growing up in poverty. Such needs require additional academic support and care. That is not what is happening in Montana. The student population in public schools has remained largely the same since the 2018-19 school year.
Consider the following changes across all of Montana’s 826 public schools over the past five years:
- Total Enrollment. In total Montana public school enrollment grew approximately 2,788 students.
- SPED. The population of students with diagnosed disabilities increased by 1,732 students.
- ELL. The population of English language learners grew by 716 students.
- FRL. Students eligible for the National Free & Reduced Lunch Program (FRL), a key measure of low-income, increased by 568 students.
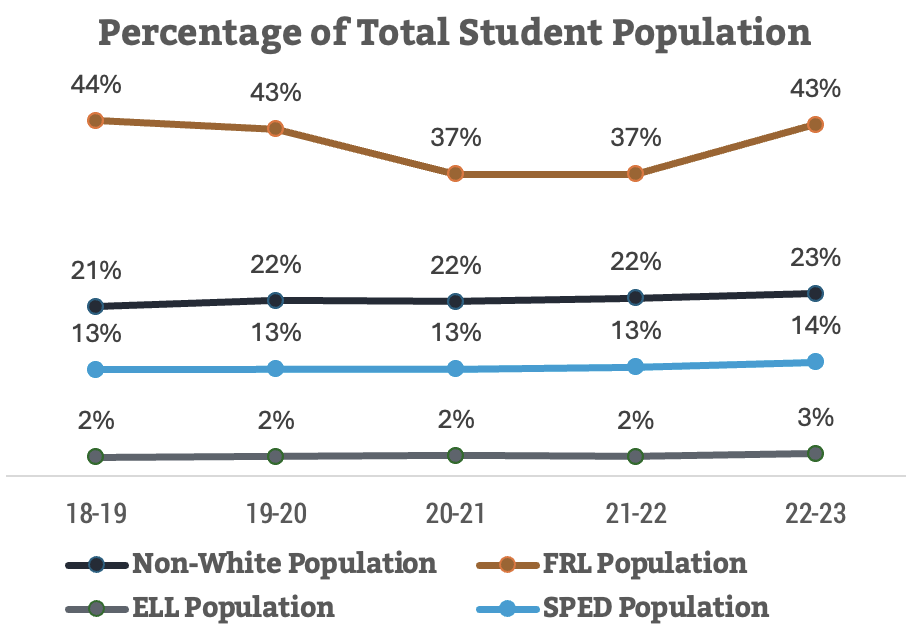
When we look at the number of SPED, ELL, and FRL students as a percent of the entire state’s student population, we see that the student demographics are virtually unchanged.
As the following chart indicates, FRL eligible students continue to make up 43% of the total student population. We also see minimal change in the percentage of ELL, and SPED students that public schools are serving. So, what do these statistics tell us?

They tell us there has been no significant change in the population of students that require additional instructional services or support services and, therefore, additional funding. For the past five years, Montana’s student body has remained largely the same.
If the need for additional funding is not rooted in a changing student body, the need might be caused by a significant increase in total student enrollment in Montana public schools. But as we pointed out earlier, enrollment has only increased by 2,788 students, which represents a 1.9% increase.
Has School Funding In Montana Declined?
Another possible reason to increase funding could be that Montana school funding has remained flat or even declined over the past five years and it is time for the state to reinvest in education.
Quite the opposite.
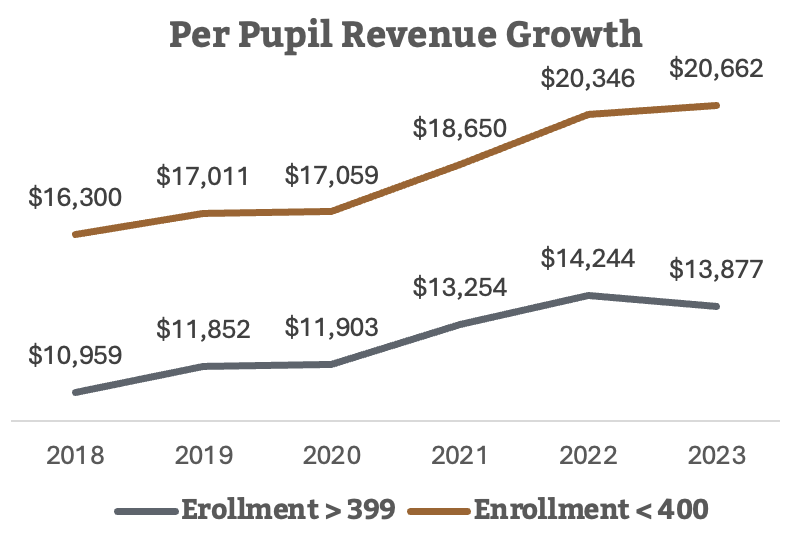
In 2018, Montana public schools received between $11,000 and $16,000 per pupil depending on the size of the school. As of 2023, that amount increased to anywhere from $14,000 to $21,000 per pupil, which represents a 27% growth over five years.

Since 2018, total enrollment in Montana public schools only increased by 2% but funding grew by 27%. As the chart indicates, average funding among K-12 schools with more than 400 students grew by $2,918. Among schools with fewer than 400 students, most likely serving smaller rural areas, funding increased by $4,362 per pupil.
With such significant investment growth into public schools, Montanans should expect public school performance to improve. Yet there is no evidence that it has.
So Where Is All The Extra Money Going?
To help determine where the money is going, we have prepared the following table. This chart represents what percentage of Montana’s per pupil funding is going toward each area of school operations. For example, in 2017, about 52.4% of per pupil funding was directed towards “Instruction.”

What we clearly see represented in this data is that schools are spending less of their total funding in two key areas, Instruction and Student Services.
- “Instruction” covers salaries, benefits, supplies, and other costs for activities “dealing directly with the interaction between teachers and students.” This includes the teachers, but also instructional aids, graders, clerks, materials, and other resources intended to support learning.
- “Student services” can be categorized as wraparound support for students such as social workers, nurses, counselors, college/career guidance, and any other direct student services to enhance and support instruction.
Over the past seven years, instruction and student services have gotten a smaller and smaller slice of the funding pie as schools spend more money on facilities and administration. Although the change in percentages year to year appears small, if we look at them in terms of real dollars allocated to the classroom, the difference is stark.
According to the Office of Public Instruction’s financial data, the average per pupil spending in 2023 was approx. $14,451. For a classroom of 25 students, that represents $361,275 in funding. If the state of Montana allocated the same percent of money to instruction in 2023 as in 2017, that would mean that $189,308 would be spent in the classroom. Instead, Montana schools directed, on average, only $177,386 into the classroom, a difference of $11,922.
Frustratingly, teachers appear to be getting the short end of the stick. The average Montana salary is around $53,000, less than 15% of the funding available for a classroom of 25 students and only 30% of what the schools say they are spending on instruction.
It is a worrisome trend that Montana schools are spending less and less on instruction and student services each year. Whether schools are compelled by state regulations or the cost of managing school operations is increasing, Montanans must ask if schools are using their resources wisely. Money should be allocated to the positions directly serving students – teachers and student support staff – but that does not appear to be happening.
Getting More Bang For The Buck
The challenge facing Montanans in the coming year is not simply about whether or not to raise property taxes. Instead, Montanans should be asking a more basic question – is the current system of public education working for public school students?
Between 2010 and 2022, the Treasure State has increased total spending on public education by $745,509,486, which reflects a 46% increase. Yet over that same time, public school enrollment only increased by 8,766 students or 6%. Montana has very little to show for such a large investment.
What Montanans must consider is whether to accept more of the same or take a different approach to K-12 education. By investing taxpayer dollars in innovation, school choice, and healthy competition, Montana may be able to start getting more bang for the taxpayer buck.


