Over the past 8 years, a heated debate has been raging in America. This debate is over the rightful emphasis to place on standardized testing as a measure of student learning. Opponents claim that testing is an unfair measure that gives preference to students from privileged socioeconomic backgrounds at the expense of underprivileged students. While advocates argue that testing provides a valid across-the-board measure that reveals where academic improvements need to be made so that all students can get a high-quality education.
According to the National Literacy Institute, forty percent of all American children cannot read at even a basic level. Perhaps more disturbingly, 70 percent of low-income fourth graders cannot read at a basic level. Year after year, standardized tests – which measure student numeracy, reading, writing, civics, and science – show us that far too many of our K-12 schools are not enabling students to learn grade-level knowledge and skills.
Is the right response to deprioritize testing, so that we don’t know if we are preparing students to be literate citizens, or to focus on making improvements with testing as a key indicator?
For this second edition of our 12-month series on the state of Montana education, we decided to highlight the NAEP because it is the single most authoritative assessment for evaluating the elementary and secondary performance of U.S. public and private schools. As readers enter this important topic, we encourage you to do so with an open mind.
Understanding The NAEP
The NAEP is called the Nation’s Report Card for at least four good reasons:
- The Long-term View. The NAEP is a valid national measure of student achievement in primary subjects from grades 3-12 administered at public and private schools nationwide. It is the only long-term assessment that the U.S. Department of Education uses to assess how well students are learning desired content and skills across major subject areas.
- Primary Subjects. By reviewing student achievement on the NAEP, we see how effectively students are learning the primary subjects, including reading, writing, mathematics, U.S. history, civics, and science. These subjects are not that difficult to test – students either have good command of the knowledge and skills that they need to progress towards becoming functioning American adults or they do not.
- Constant, Stable Measurement. Unlike state tests, which often changed the past 20 years, the NAEP evaluates achievement the same time-tested way. Thus, by looking at the percent of students that score across four categories – from “below basic” and “basic” to “proficient” and “advanced”, we can see if students are getting the quality of education that they deserve. Generally, a rating of “proficient” or “advanced” indicates good command of grade-level content where a rating of “below basic” or “basic” is considered well below grade level.
- Meaningful Comparisons. The NAEP can be used to examine achievement trends within the same states over time, across states, and across the U.S. Without the NAEP, we have no consistent, valid means of determining if we as a nation are doing a good job.
According to the Nation’s Report Card website, “NAEP provides a common measure of student achievement across the county. Because states have their own unique assessments with different content and standards, it is impossible to use them as a means for comparing state achievement. Such comparisons are possible with NAEP, however, because the questions and administration of the assessment are the same across all states.”
What The NAEP Reveals About Montana’s Performance
The best way to look at student achievement is to evaluate the learning gains that the same statewide “cohorts” or representative cross-sections of students made over time. If we can see what percent of that cohort of students scored “at or above proficient” in 4th grade then again in 8th grade, we can see the learning gains that students made relative to grade level content.
There are only two NAEP subjects, Reading and Mathematics, where students are tested frequently enough to see progress from 4th to 8th grade. Fortunately, those are the two most important subjects because they demonstrate if students are gaining basic literacy skills. According to the NAEP, “students performing at or above proficient showing solid academic performance and competency over challenging subject matter.”
Reading – The Better Of The Two Subjects
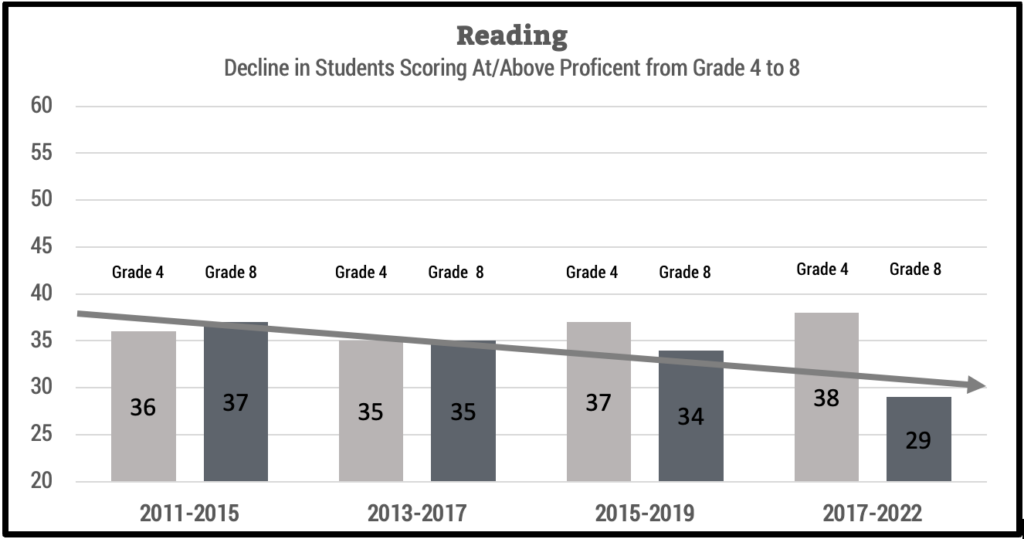
To see what the trends are, we examined four successive cohorts of Montana students as they moved from 4th grade to 8th grade. What we found was revealing…and concerning. Below, the bar chart shows the progress that students made in Reading.

What does this bar graph tell us? From 2011 to 2015, the first cohort of students made a gain of 1 percentage point meaning that only 36 percent of students scored at/above proficient in 2011 and 37 percent of the same statewide cohort of students scored at/above proficient in 2015. To tell it straight, this growth in student achievement is insignificant but shows growth nonetheless.
Unfortunately, the story is not as favorable for the next three cohorts of students. From 2013 to 2017, the second student cohort made no progress – 35 percent scored at/above proficient in 2013 and 35 percent scored at/above proficient in 2017. Each cohort since then has not done as well. From 2015 to 2019, the percent of students scoring at/above proficient declined from 37 percent to 34 percent. From 2017 to 2022, the percent of students scoring at/above proficient declined by a whopping 9 percent, from 38 percent to 29 percent. These results show that, in 2022, 71 percent of 8th grade students achieved below basic or basic – they did not reach proficiency.
Thus, the most accurate way to read these trends is that, in the past 11 years, student achievement in Montana has declined. Although Montana was sustaining modest growth from 2011 to 2015, it is now sustaining major declines from 2017 to 2022.
Math – The Worse Of The Two Subjects
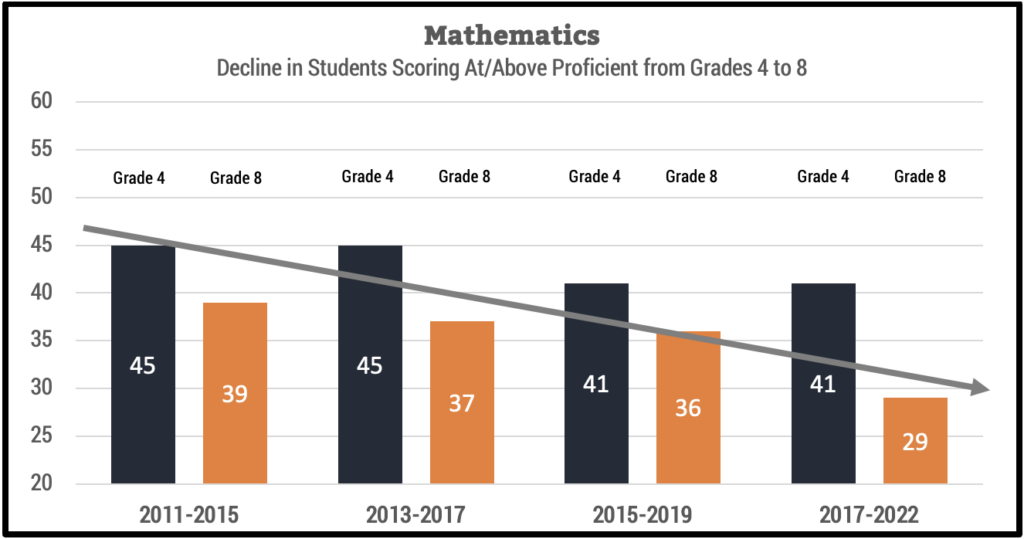
To get a sense of how well Montana’s public schools are performing in Mathematics, we took the same approach. To see the trends, we examined four successive cohorts of students moving from 4th grade to 8th grade in Montana’s public schools. In this case, the results are ALARMING. Below, the bar chart shows the declines that four cohorts of students made in Mathematics.

What does this bar graph tell us? From 2011 to 2015, the first cohort of students registered a decline of 6 percentage points meaning that 45 percent of students scored at/above proficient in 2011 and only 39 percent of the same cohort of students scored at/above proficient in 2015.
Unfortunately, the story only gets worse with the next three cohorts. From 2013 to 2017, the second cohort of students registered even steeper decreases – 45 percent scored at/above proficient in 2013 and 37 percent scored at/above proficient in 2017. From 2015 to 2019, the percent of students scoring at/above proficient declined from 41 percent to 36 percent. From 2017 to 2022, the percent of students scoring at/above proficient declined by a whopping 12 percentage points, from 41 percent to 29 percent. As with Reading, these results indicate that, in 2022, 71 percent of 8th grade students scored below basic or basic – they did not demonstrate proficiency.
Thus, the most accurate way to read these trends is that, for the past 11 years, student achievement in Montana has been falling steadily in Mathematics.
The Pandemic – The Elephant In The Room?
One big obvious question to ask about is the impact of Covid-19. When taking the Pandemic’s effects into account, one positive factor is that Montana schools remained open with the exception of 2-3 months in the spring of the 2020-21 year. Whereas many other states closed their public schools, sometimes for as much as 18 to 24 months, Montana’s public and private schools continued to provide live classroom instruction without resorting to remote learning for an entire academic year.
When reviewing the bar charts above, it is worth noting that 3 of the 4 cohorts of students took the NAEP tests between 2011 and 2019, before the Pandemic broke out. These students’ achievement is not indicative of the Pandemic. The only cohort of students that was directly impacted by Covid-19 is the fourth one, which was not impacted in 2017 but took the NAEP tests again in 2022.
Due to the Pandemic, Montana administered the NAEP Reading and Mathematics tests between January and March of 2022 instead of 2021. This gap means that we are not looking at the same cohort of students from 4th to 8th grade, but rather, looking at two cohorts of students.
Overall Findings & Conclusion
What do student outcomes on the NAEP say about Montana? Looking across the testing years, Montana shows a significant long-term decline in both Reading and Mathematics. This decline is supported by testing trends over 11 years – it is generally consistent across four successive cohorts of students statewide, not exceptional.
This trend should raise big legitimate questions about the overall state of Montana education. Attributing declining scores to the Covid-19 challenges of remote learning and disrupted schedules would be too simplistic and misleading since negative trends were evident across both primary subjects for at least 9 years prior.
In 2022-23, the most recent year of NAEP testing that we evaluated, there were 166,251 K-12 students enrolled in Montana public, private, and home schools. Of that total, approx. 12,800 students were completing 8th grade. If 71 percent of 8th grade students continue to score below basic or basic on the NAEP Reading and Mathematics for the next 11 years nearly 100,000 students will pass through 8th grade who are not on track to become literate citizens.
Call to Action
Montana educators and families need to understand the root causes of this decline. Are curriculum changes, teaching methodologies, or systemic operational issues impacting student achievement? Or does this data underscore a need for broader change in the state’s K-12 education system?
With this information in hand, it remains to be seen what steps Montanans will take to reverse the downward trend. Right now, it appears that the NAEP scores show increasingly sharp declines without any improvements in sight. Such a downward trajectory cannot be corrected with one cohort of students across one four-year period.
As we continue our monthly series on Montana education, we will gather more trend data and information to understand what the effects have been on Montanans and what constructive actions can be taken.


